Why Post-Void Images on a Radionuclide Cystogram
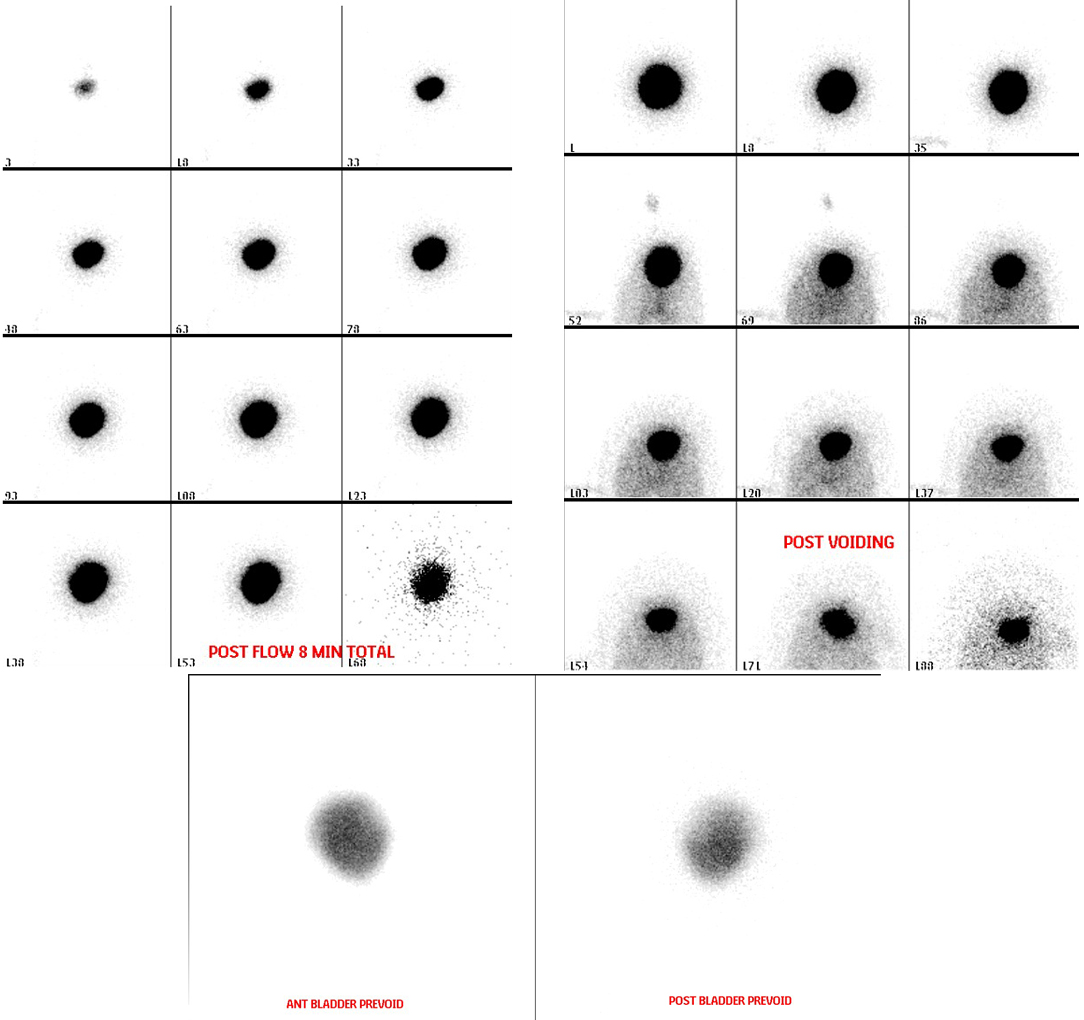
Provided clinical image
Question
Looking at the post-voiding images on this direct radionuclide cystogram, what is the PURPOSE of obtaining images AFTER the patient voids?
- ATo measure the total amount of radiotracer injected into the bladder and calculate the exact administered activity for dosimetry records
- BTo assess kidney function by measuring how quickly the kidneys clear the tracer that refluxed into the renal pelves during bladder filling
- CTo detect vesicoureteral reflux that occurs only during the voiding phase when bladder pressure is highest, and to measure post-void residual bladder volume
- DTo verify proper catheter placement and confirm that all instilled saline has been voided before the catheter is removed
Show the answer and explanation
C. To detect vesicoureteral reflux that occurs only during the voiding phase when bladder pressure is highest, and to measure post-void residual bladder volume
Post-voiding images serve two purposes: (1) They detect VUR that occurs specifically during voiding, when intravesical pressure peaks and tracer may reflux into the ureters that did not reflux during the lower-pressure filling phase — this is called 'voiding reflux.' (2) They allow calculation of post-void residual (PVR) — the amount of tracer (and therefore urine) remaining in the bladder after voiding, which can indicate bladder outlet obstruction or poor bladder emptying. Together, pre-void and post-void images give a complete picture of bladder filling, voiding mechanics, and reflux at all pressure phases.
More renal and genitourinary images
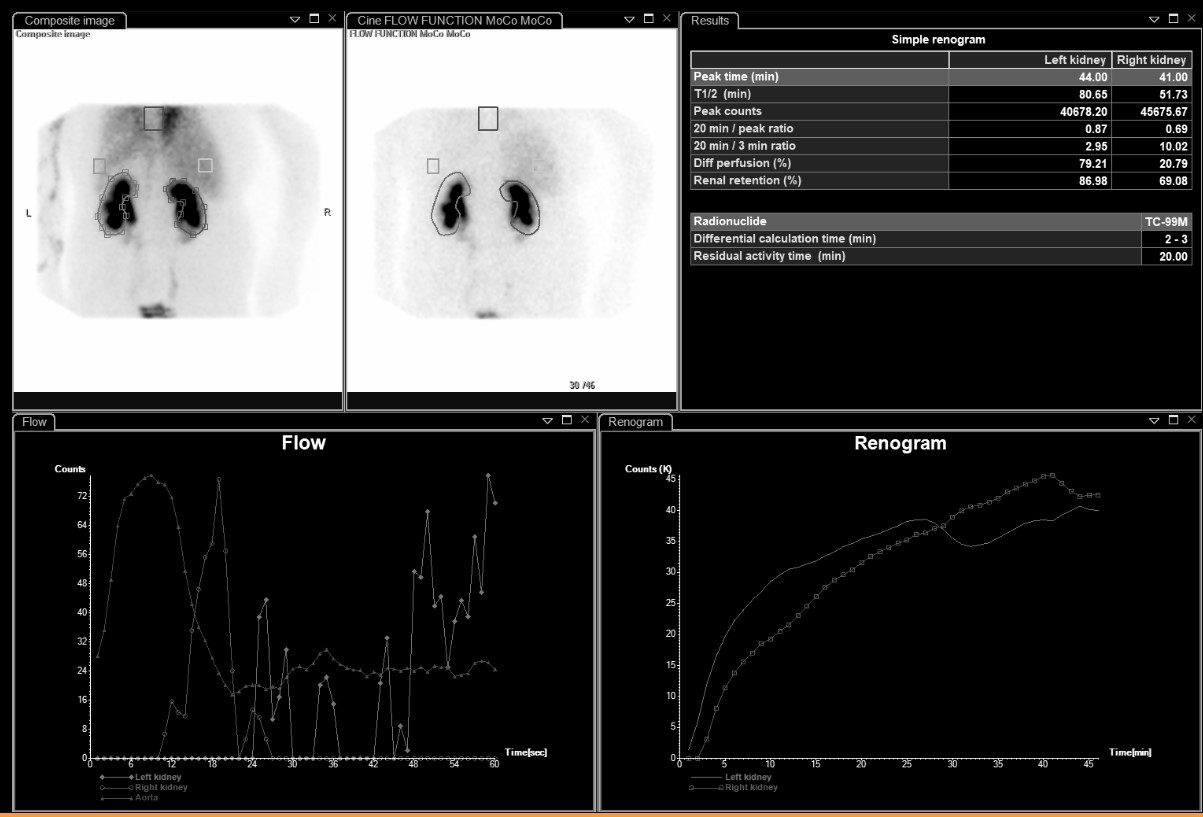 Differential Renal Function on MAG3
Bilateral Impaired Drainage on MAG3 Renogram
Motion Correction in MAG3 Renal Scans
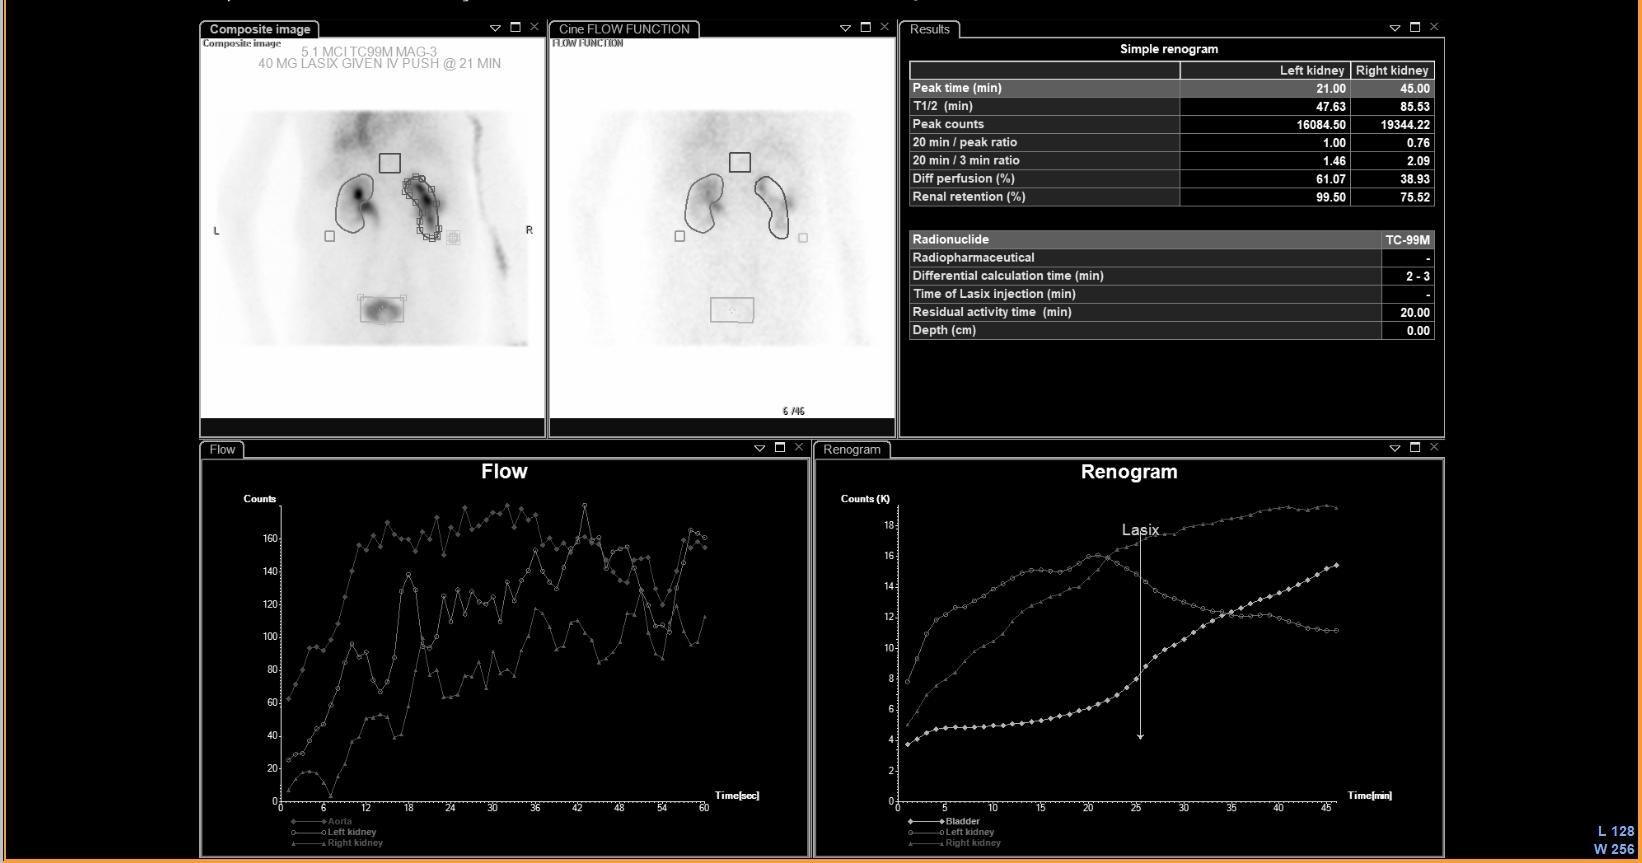 UPJ Obstruction on MAG3 Diuretic Renogram
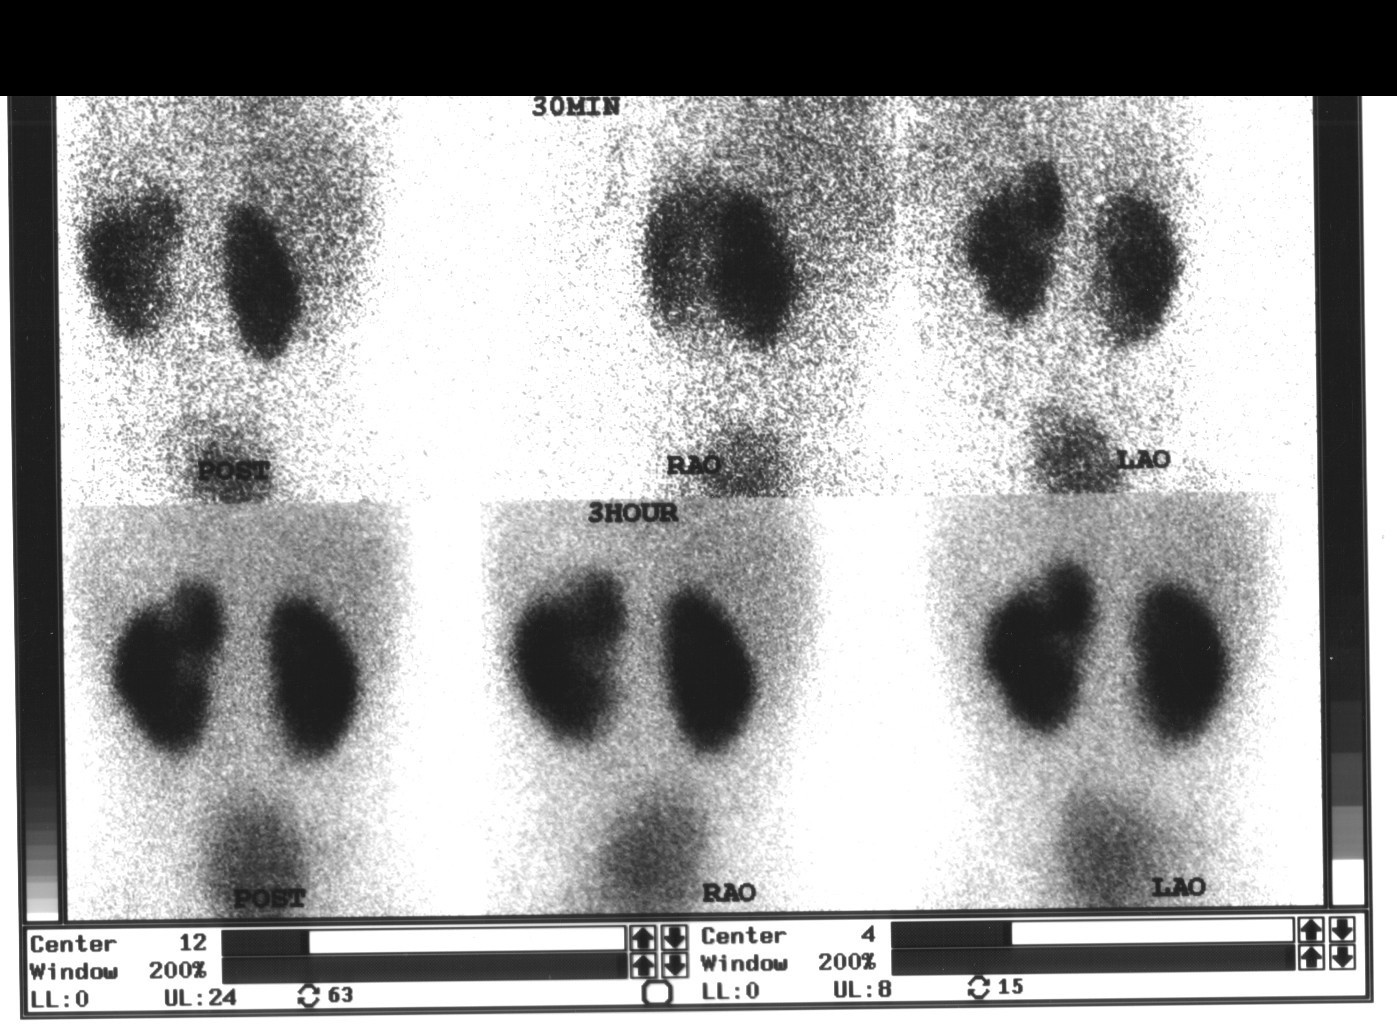 Renal Cortical Scar on DMSA Scan
 Normal Renal Drainage Half-Time on MAG3
All 130 nuclear medicine images by category →
Practise image interpretation in the app
All 130 images as an interactive quiz, alongside 500 NMTCB and ARRT(N) questions with worked explanations, case studies and timed mock exams. 25 questions are free, no card and no account.