Bilateral Impaired Drainage on MAG3 Renogram
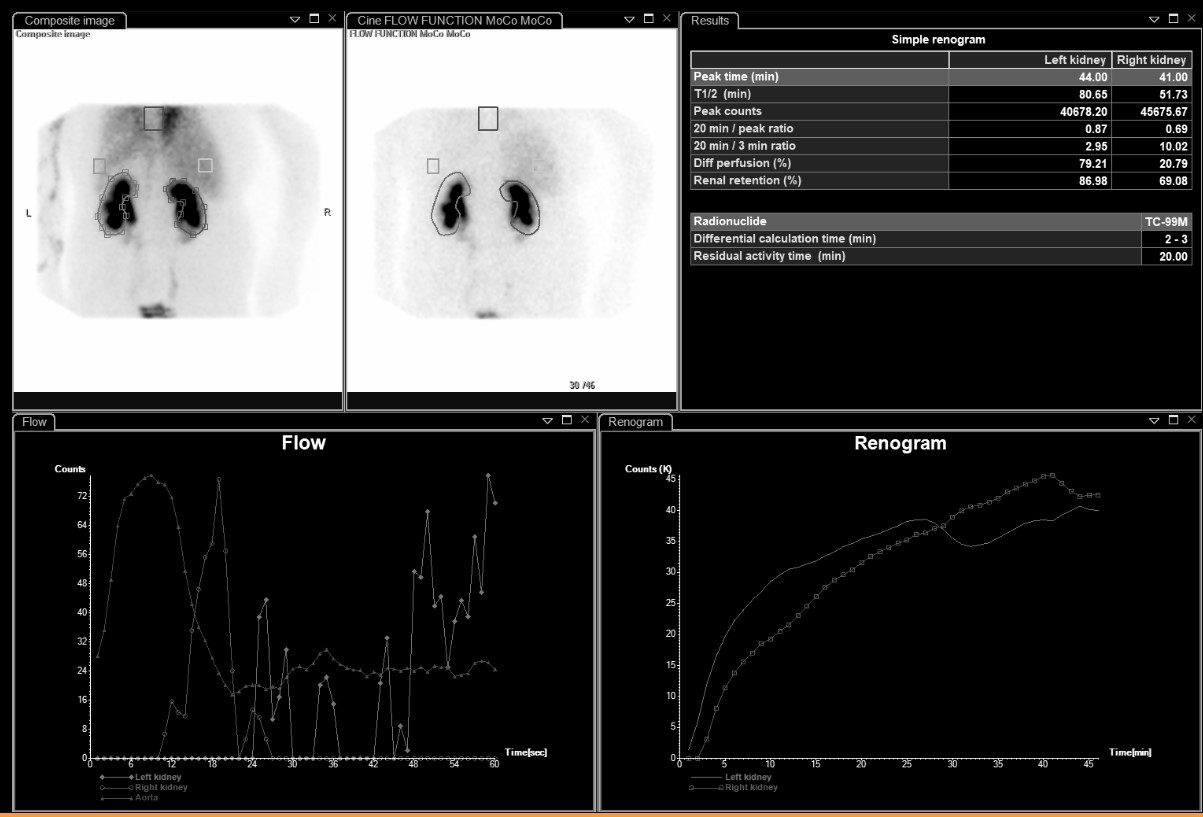
Provided clinical image
Question
On the renogram shown, both kidney curves rise continuously throughout the study and neither kidney reaches a clear peak followed by decline. Left T½ = 80.65 min, Right T½ = 51.73 min. What does this pattern most likely indicate?
- ANormal bilateral renal function — the rising curves reflect ongoing tubular secretion of MAG3 and indicate both kidneys are actively processing tracer
- BThe patient voided early in the scan, causing a drop in bladder activity that shifted the kidney curves upward artificially
- CBoth kidneys have severely impaired drainage — T½ values of 80 and 51 minutes far exceed the normal upper limit of 10 minutes
- DThe imaging time was too short — extending the study to 60 minutes would show both curves reaching a peak and beginning to clear normally
Show the answer and explanation
C. Both kidneys have severely impaired drainage — T½ values of 80 and 51 minutes far exceed the normal upper limit of 10 minutes
A normal renogram curve rises to a peak at 2–5 minutes and then declines as tracer drains from the kidney. When both curves continue to rise without ever declining, it means tracer is accumulating in the collecting systems faster than it is draining — indicating bilateral obstruction or severely impaired drainage. A T½ above 10 minutes is abnormal; values of 80.65 and 51.73 minutes are markedly prolonged. A diuretic challenge (furosemide) would typically be administered to confirm true obstruction.
More renal and genitourinary images
Motion Correction in MAG3 Renal Scans
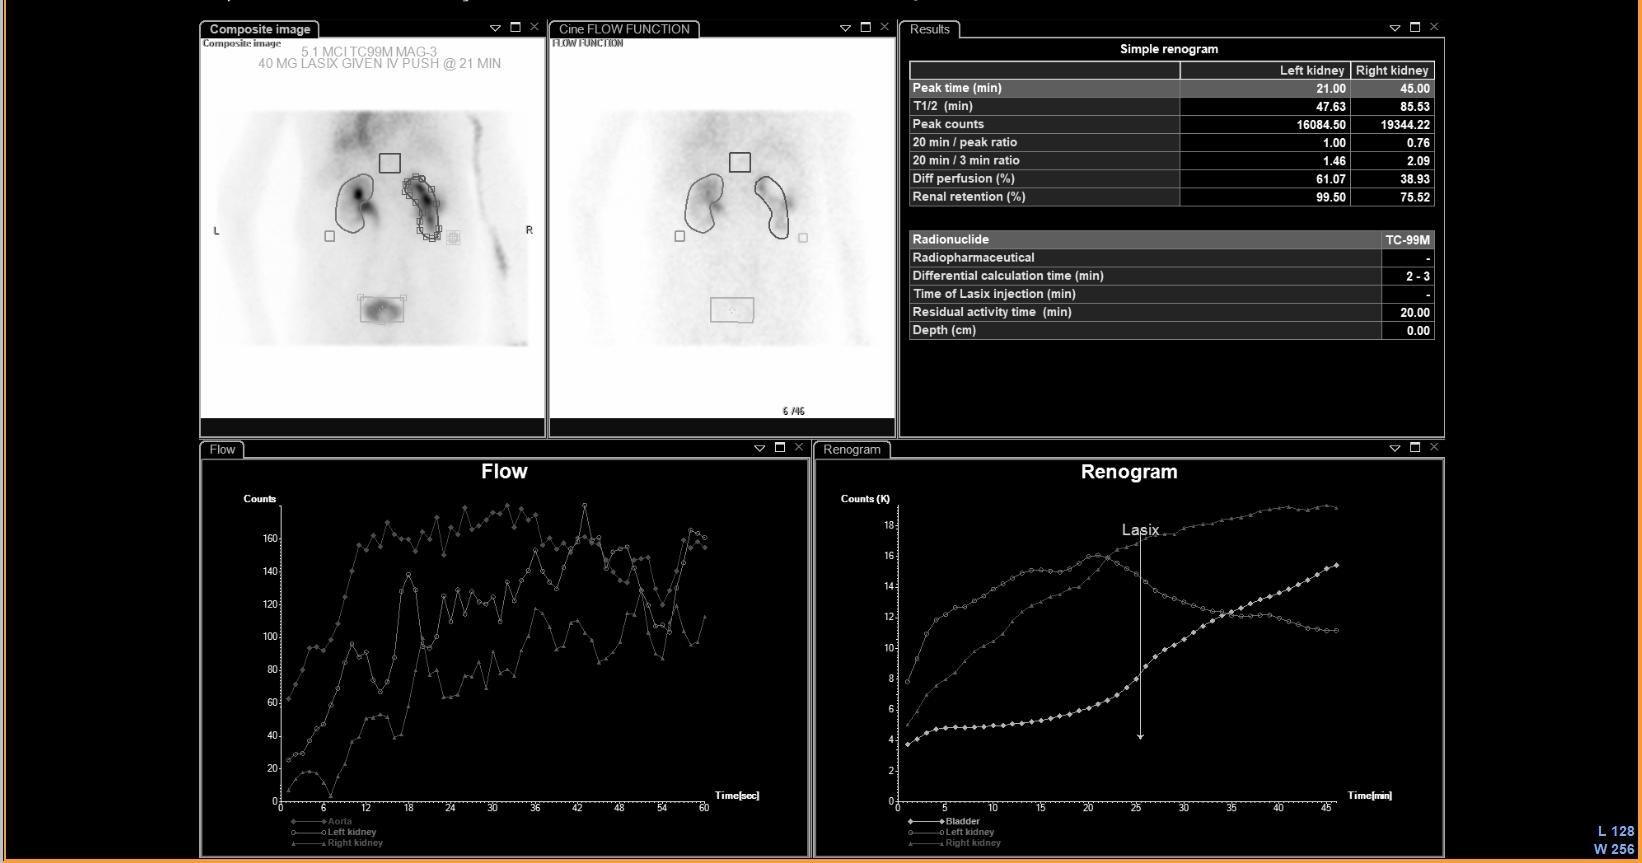 UPJ Obstruction on MAG3 Diuretic Renogram
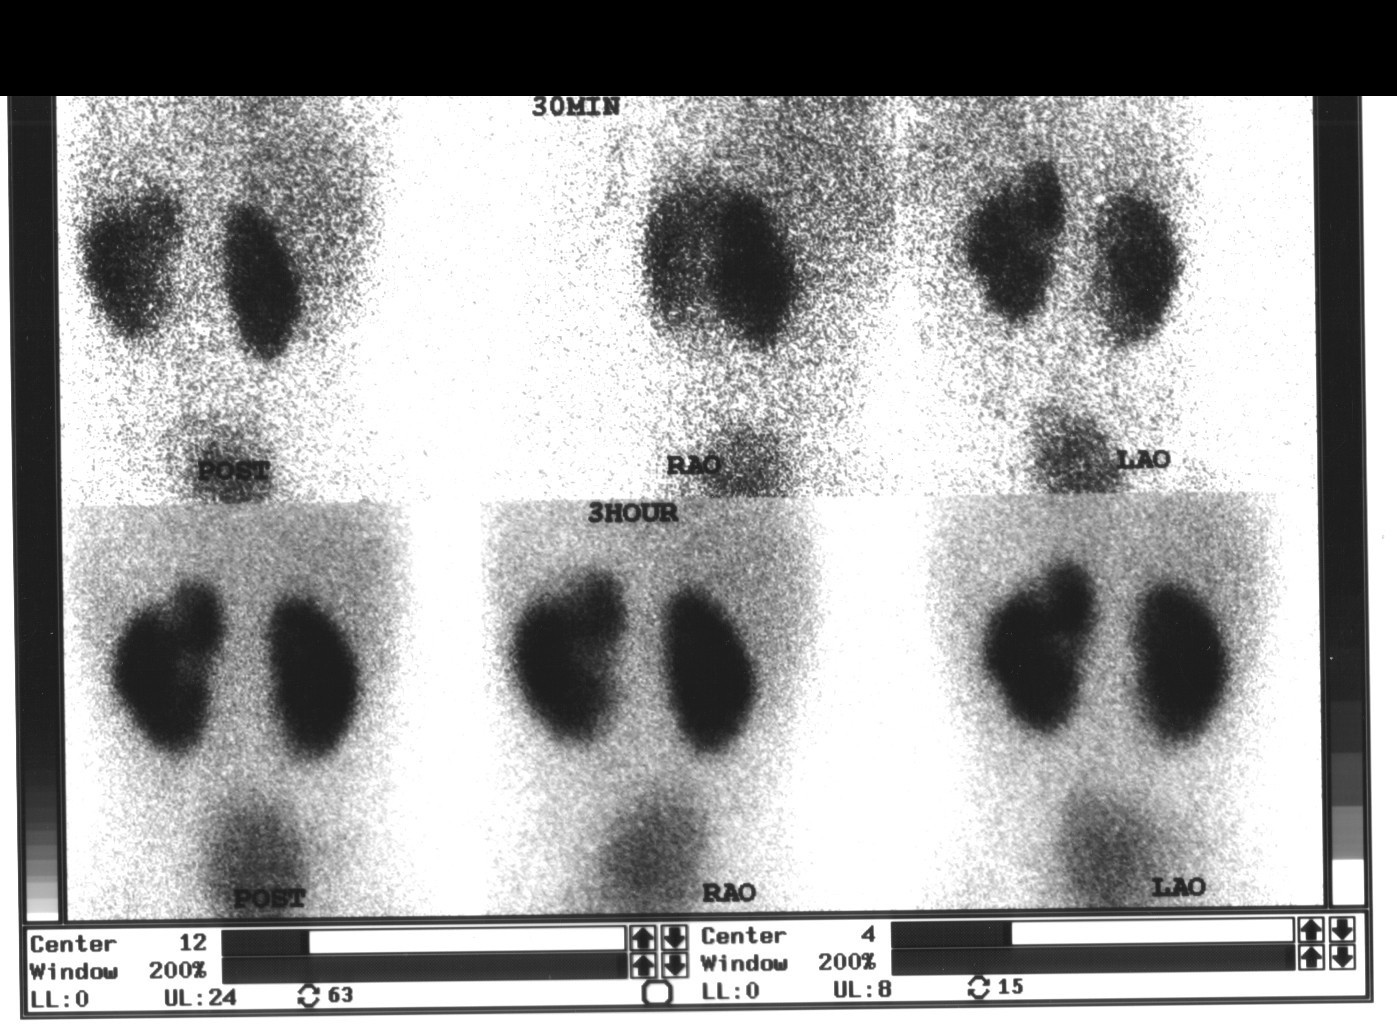 Renal Cortical Scar on DMSA Scan
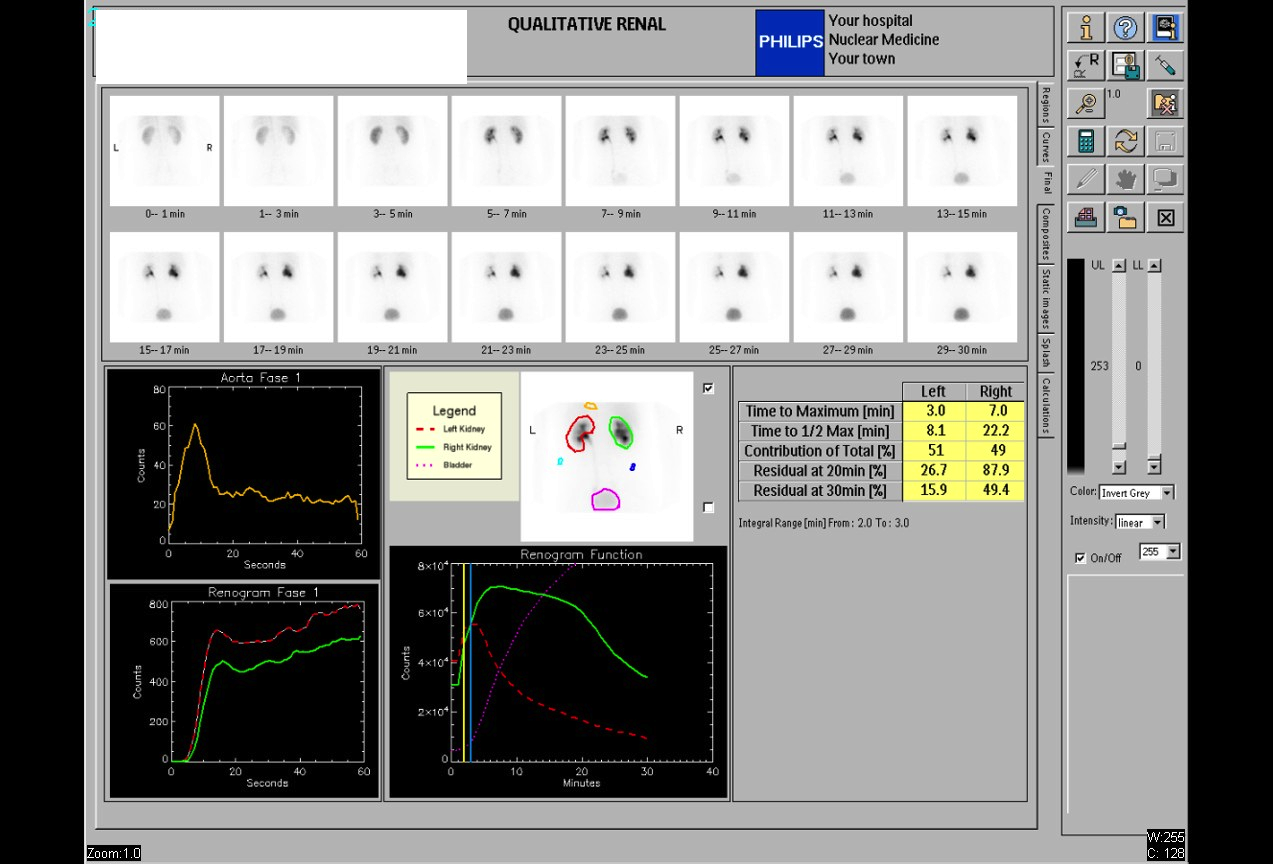 Normal Renal Drainage Half-Time on MAG3
Why MAG3 for Renal Imaging: Tubular Secretion
Furosemide Dose for Diuretic Renography
All 130 nuclear medicine images by category →
Practise image interpretation in the app
All 130 images as an interactive quiz, alongside 500 NMTCB and ARRT(N) questions with worked explanations, case studies and timed mock exams. 25 questions are free, no card and no account.