Motion Correction in MAG3 Renal Scans
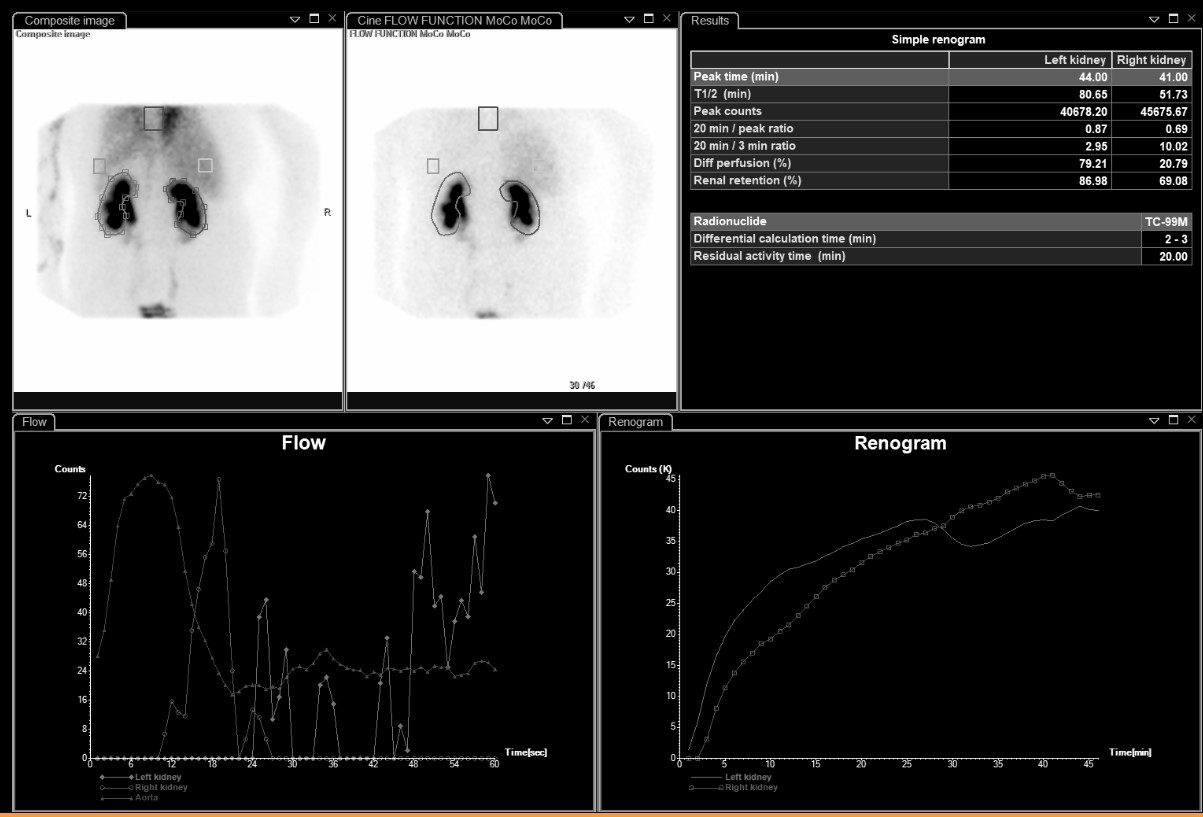
Provided clinical image
Question
This MAG3 scan was acquired with motion correction (MoCo) applied, as noted in the window header. Why is motion correction important during a renal scintigraphy study?
- AMotion correction recalculates the T½ values automatically to account for breathing artifacts that occur during the flow phase of the scan
- BMotion correction removes bladder activity from the field of view, which would otherwise lower kidney counts during the drainage phase
- CMotion correction adjusts the injected dose calculation if the patient shifts position away from the detector during tracer administration
- DPatient movement during the scan can shift the kidney outside its region of interest (ROI), causing inaccurate renogram curves and unreliable quantitative results
Show the answer and explanation
D. Patient movement during the scan can shift the kidney outside its region of interest (ROI), causing inaccurate renogram curves and unreliable quantitative results
During a renal scan, the technologist draws regions of interest (ROIs) around each kidney on early frames to generate the time-activity curves (renogram). If the patient moves during the 30–45 minute study, the kidney can shift out of the fixed ROI, causing falsely low counts that create artificially abnormal-looking curves and incorrect quantitative parameters (T½, split function, residual activity). Motion correction software realigns the image frames so that the ROIs remain accurately placed on the kidneys throughout the study, producing more reliable results.
More renal and genitourinary images
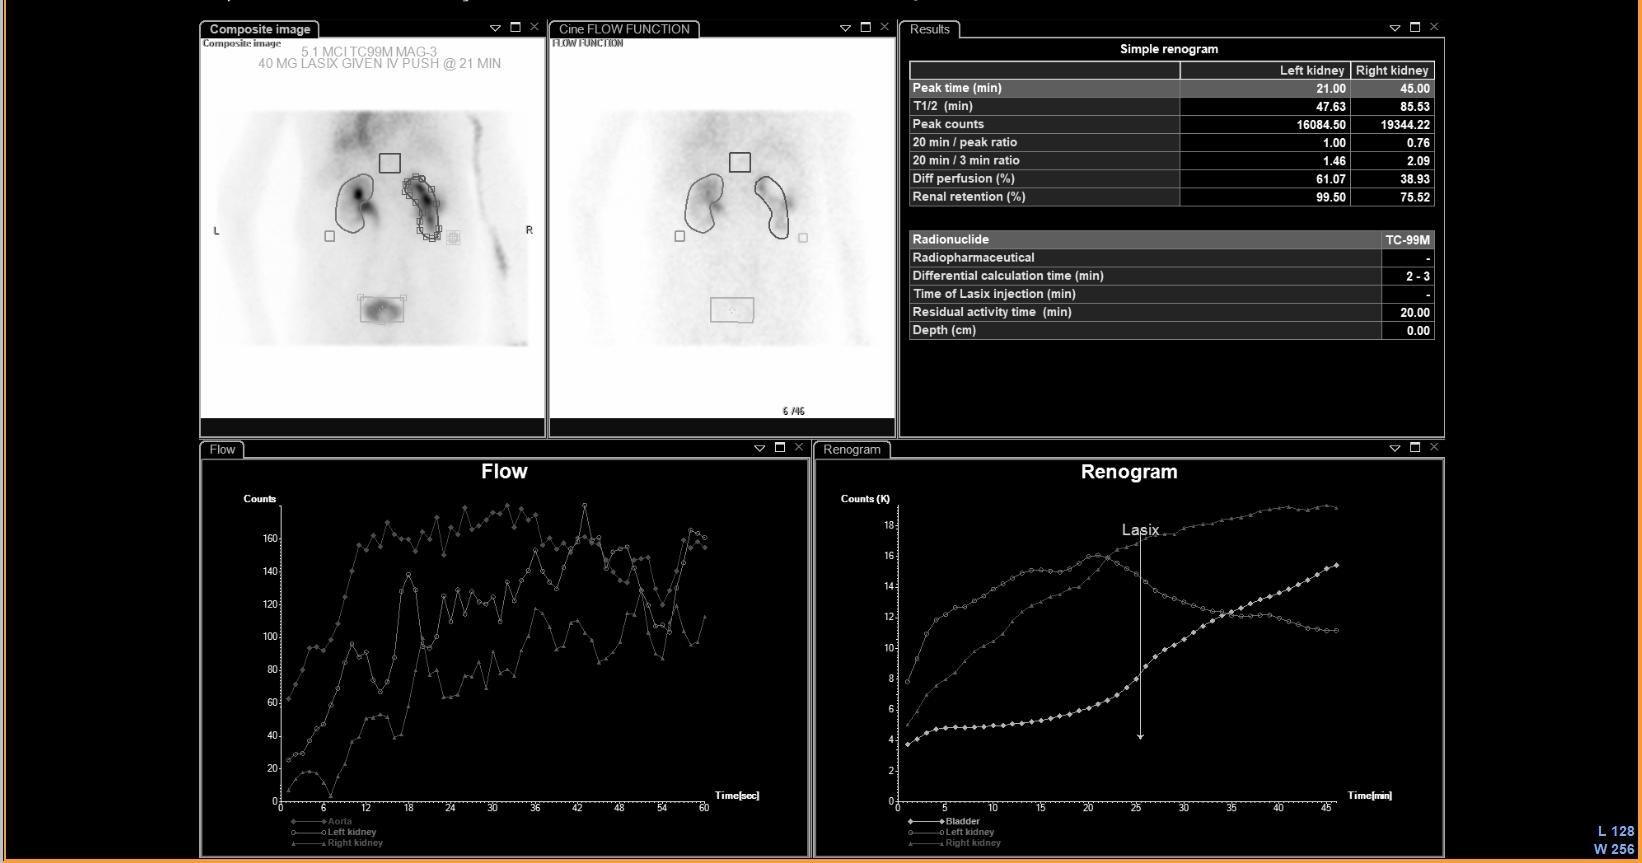 UPJ Obstruction on MAG3 Diuretic Renogram
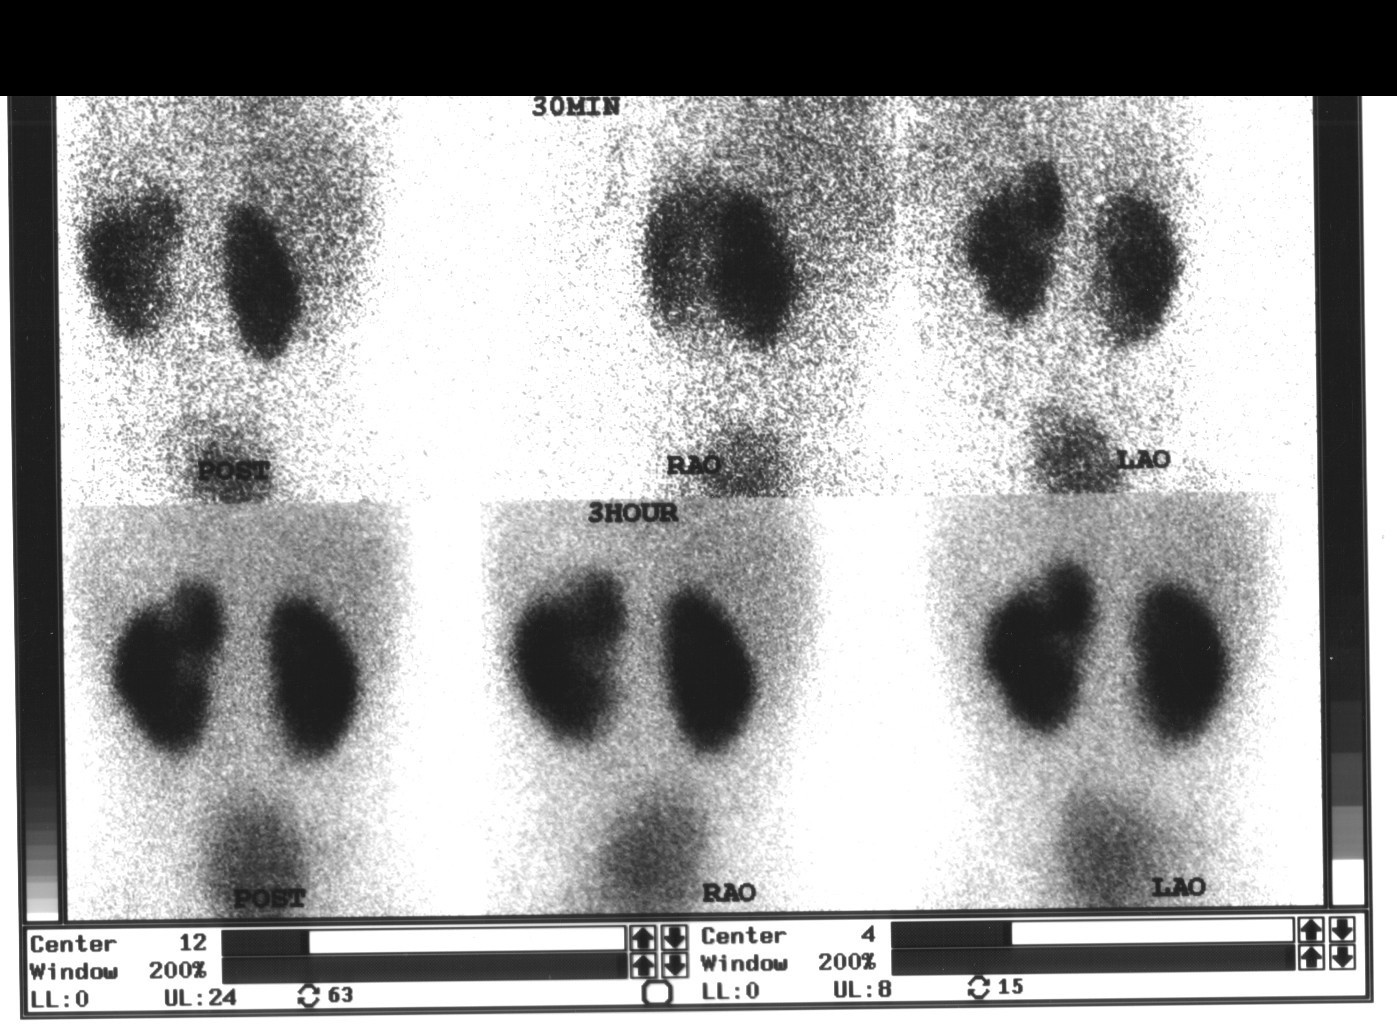 Renal Cortical Scar on DMSA Scan
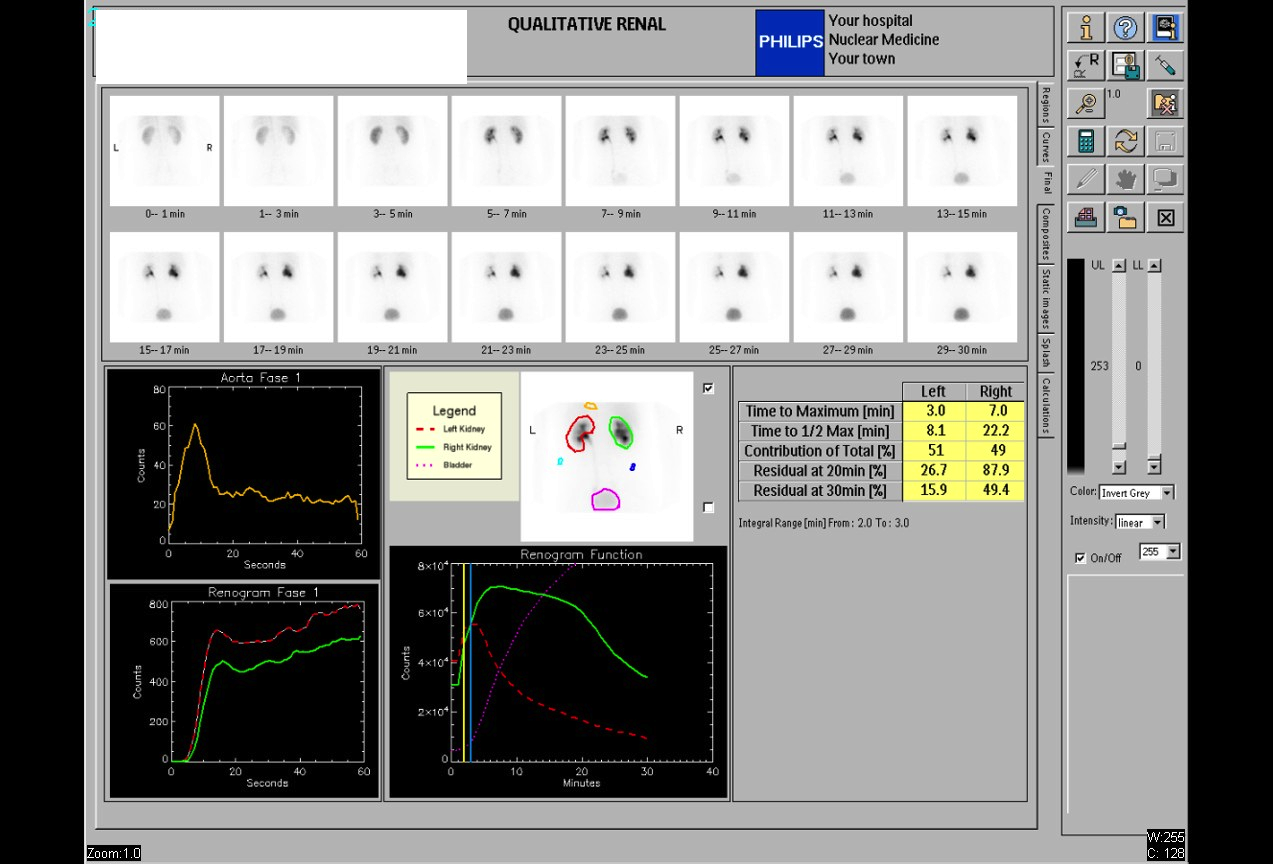 Normal Renal Drainage Half-Time on MAG3
Why MAG3 for Renal Imaging: Tubular Secretion
Furosemide Dose for Diuretic Renography
 Direct Radionuclide Cystogram Technique
All 130 nuclear medicine images by category →
Practise image interpretation in the app
All 130 images as an interactive quiz, alongside 500 NMTCB and ARRT(N) questions with worked explanations, case studies and timed mock exams. 25 questions are free, no card and no account.