Differential Renal Function on MAG3
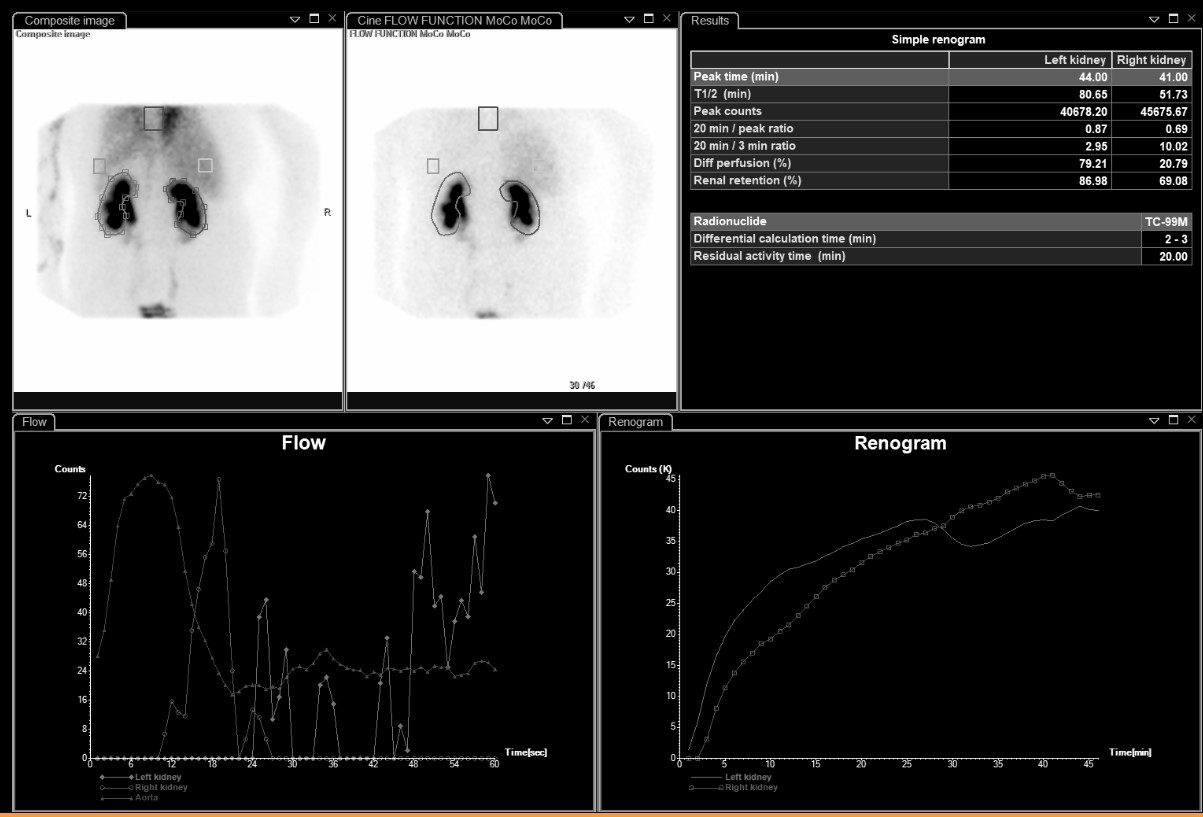
Provided clinical image
Question
The results table on this MAG3 renal scan shows 'Diff perfusion (%)' of 79.21% for the left kidney and 20.79% for the right. What does differential perfusion (split renal function) represent?
- AThe percentage of the injected dose retained in each kidney at 20 minutes post-injection
- BThe percentage of total renal function contributed by each kidney, calculated from tracer uptake during the 2–3 minute phase
- CThe ratio of each kidney's blood flow to the aortic flow during the first minute of the study
- DThe percentage of tracer excreted into each kidney's collecting system by the time of peak activity
Show the answer and explanation
B. The percentage of total renal function contributed by each kidney, calculated from tracer uptake during the 2–3 minute phase
Differential renal function (split function) represents the percentage of total kidney work performed by each kidney. It is calculated from tracer uptake during the 2–3 minute phase — early enough that the counts reflect cortical extraction rather than collecting system drainage. Normal split function is approximately 45–55% per kidney. In this scan, the left kidney is contributing 79% and the right only 21%, indicating that the right kidney is significantly underperforming relative to the left.
More renal and genitourinary images
Bilateral Impaired Drainage on MAG3 Renogram
Motion Correction in MAG3 Renal Scans
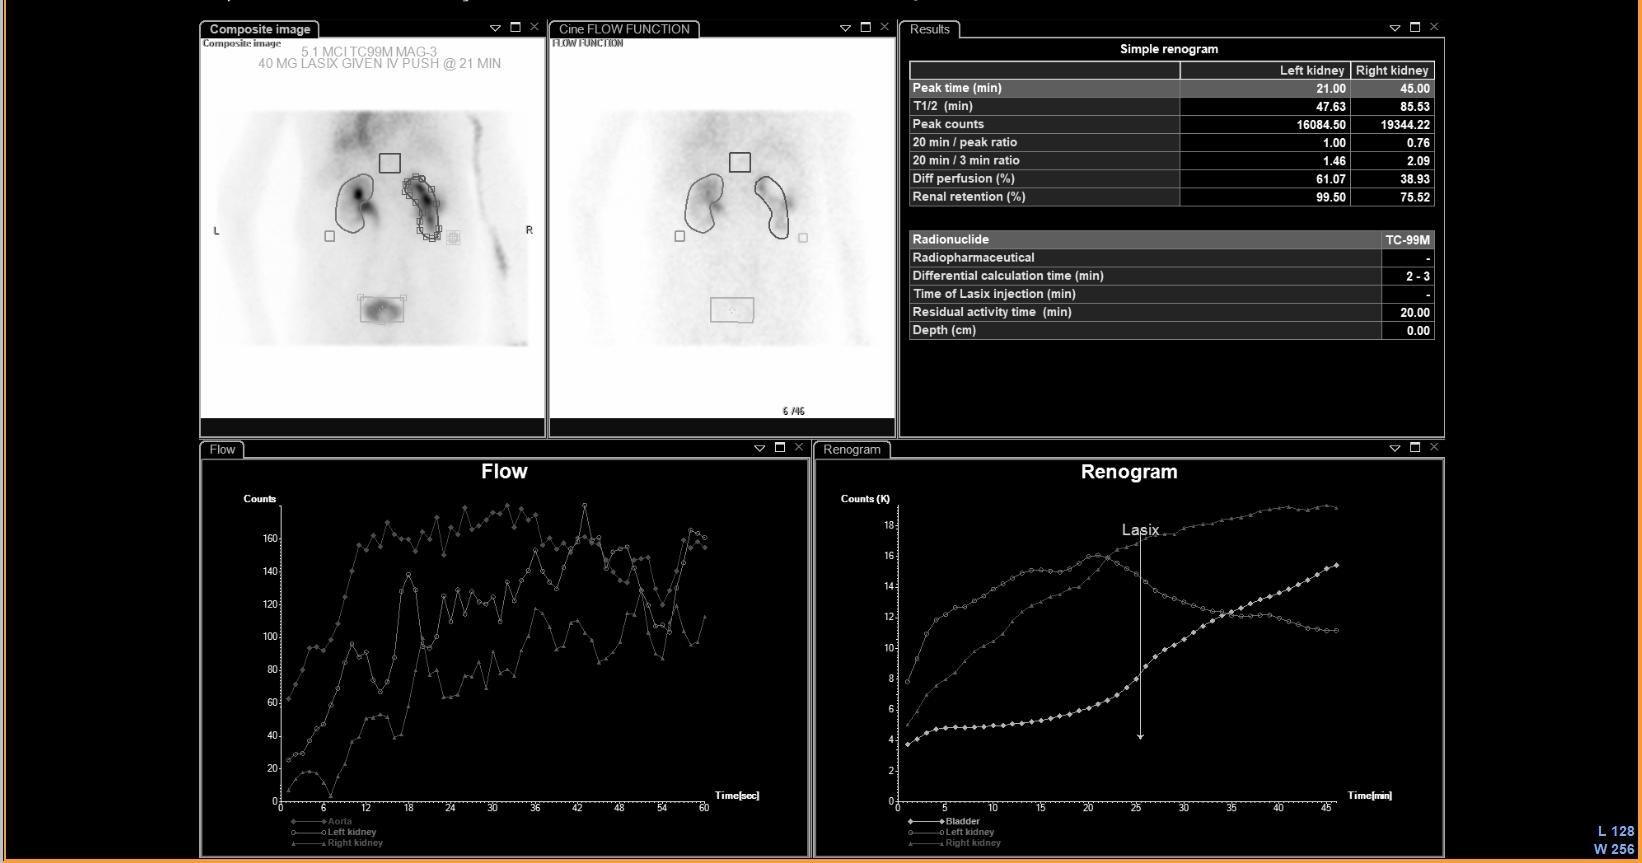 UPJ Obstruction on MAG3 Diuretic Renogram
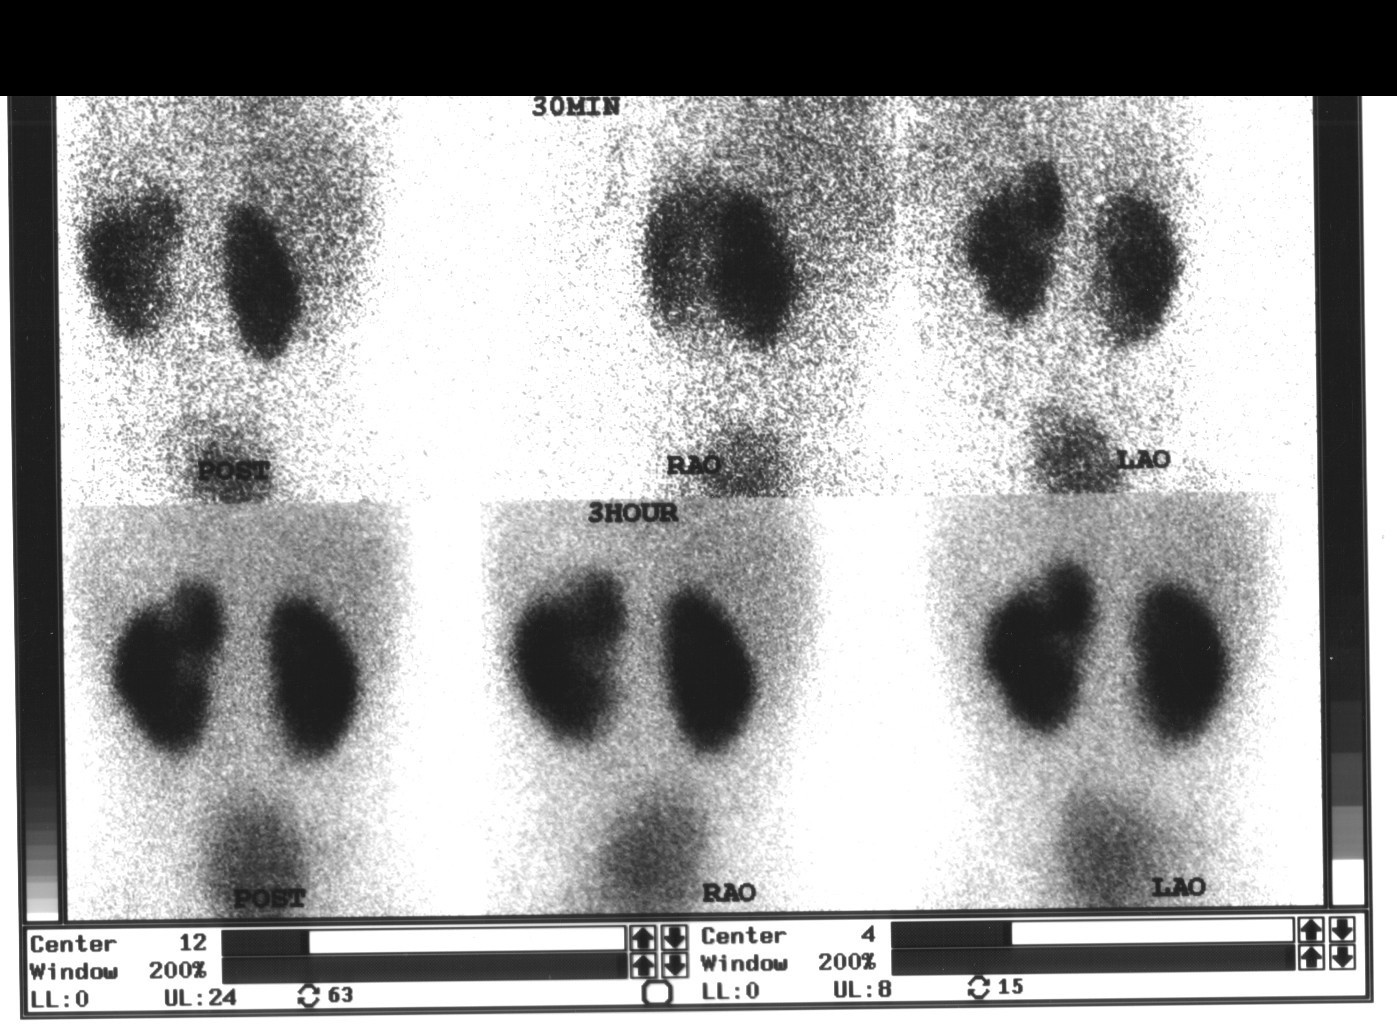 Renal Cortical Scar on DMSA Scan
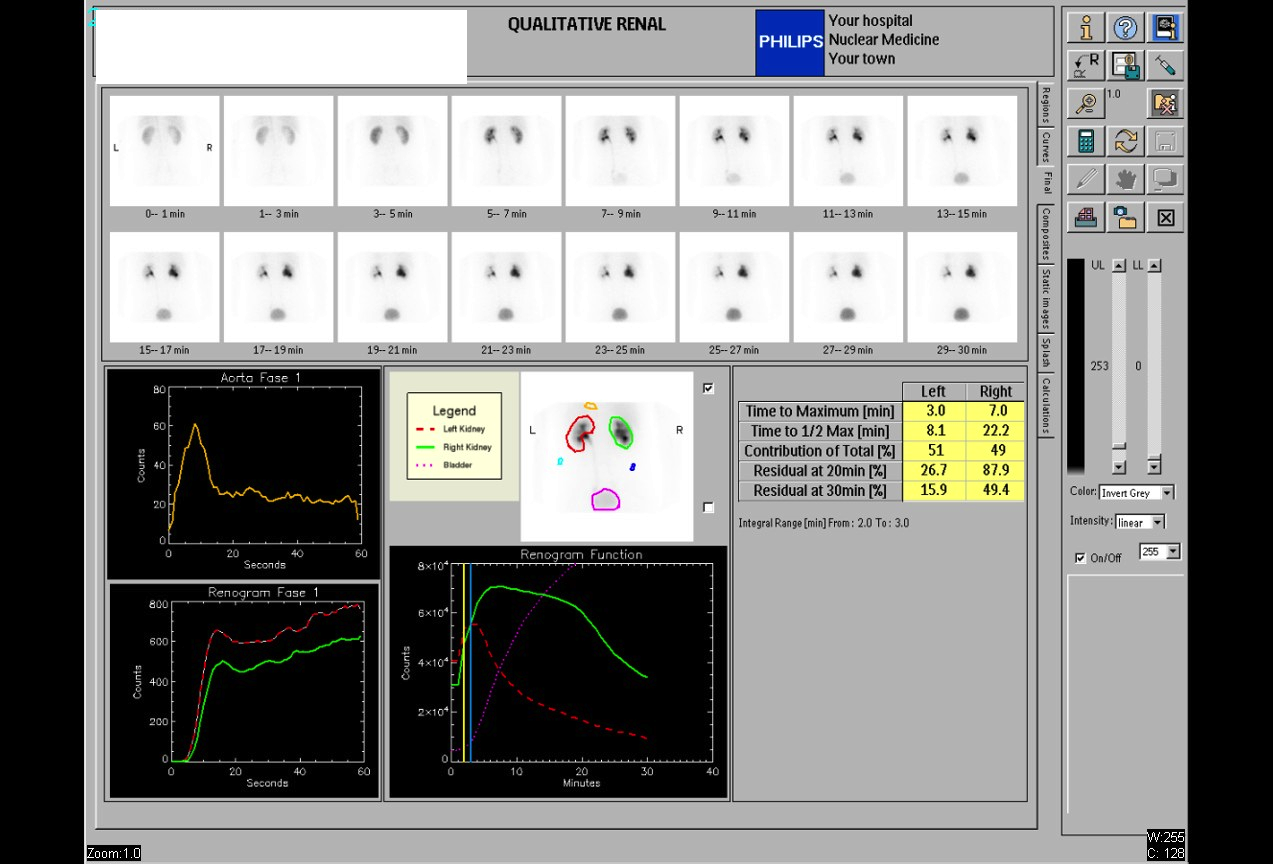 Normal Renal Drainage Half-Time on MAG3
Why MAG3 for Renal Imaging: Tubular Secretion
All 130 nuclear medicine images by category →
Practise image interpretation in the app
All 130 images as an interactive quiz, alongside 500 NMTCB and ARRT(N) questions with worked explanations, case studies and timed mock exams. 25 questions are free, no card and no account.