Ictal SPECT: Hyperperfusion at the Seizure Focus
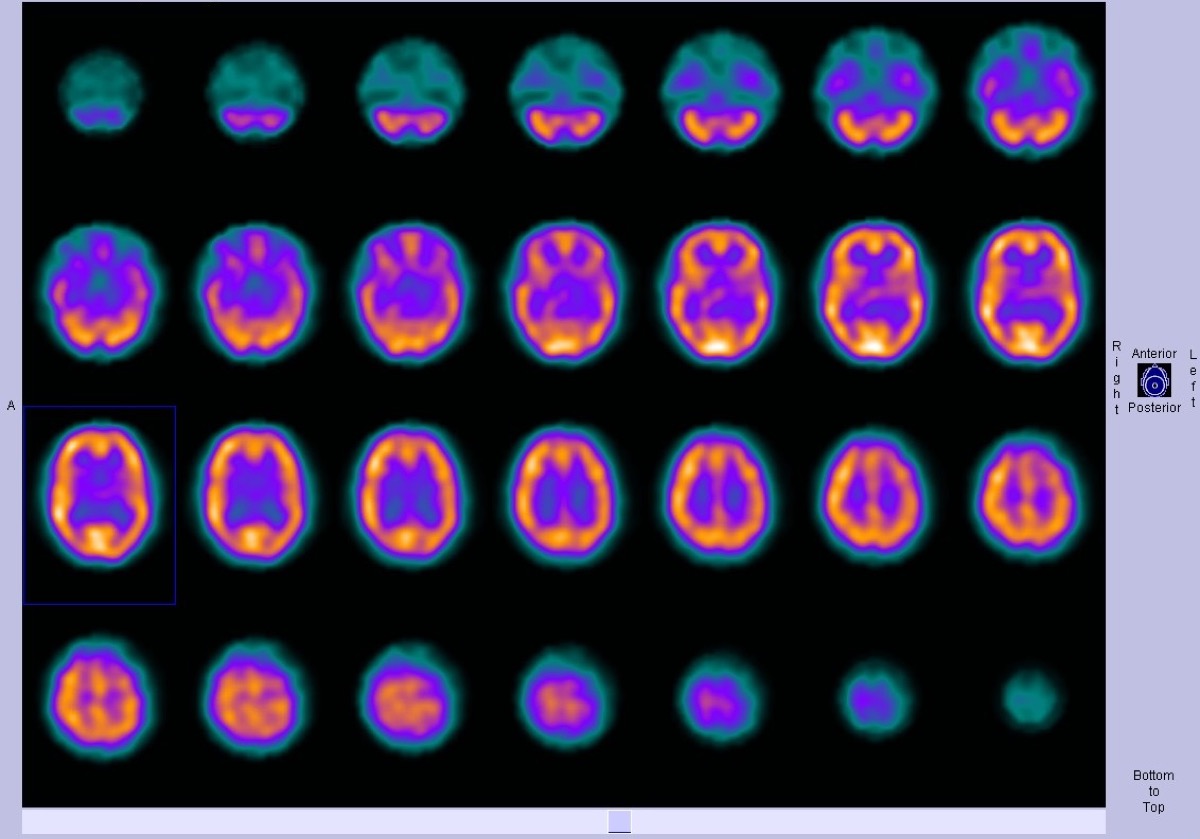
CC BY-SA 3.0 · Dr Bruno Di Muzio / Radiopaedia / Wikimedia Commons · source file
Question
Brain SPECT is used in pre-surgical epilepsy evaluation. During an active seizure (ictal phase), the seizure focus shows which pattern on brain perfusion SPECT?
- ADecreased perfusion (hypoperfusion) at the seizure focus due to neurovascular uncoupling, where excessive glutamatergic excitation triggers compensatory vasoconstriction via pericyte-mediated capillary constriction
- BMarkedly INCREASED perfusion (hyperperfusion) at the seizure focus — seizure activity dramatically increases local cerebral blood flow
- CNo change from baseline perfusion, as SPECT tracer uptake reflects cerebral metabolic rate rather than blood flow, and transient ictal activity is below the detection threshold of hexamethylpropyleneamine oxime
- DDiffuse bilateral hypoperfusion secondary to ictal propagation through commissural pathways, resulting in bihemispheric inhibitory surround suppression that overwhelms focal hyperemic changes
Show the answer and explanation
B. Markedly INCREASED perfusion (hyperperfusion) at the seizure focus — seizure activity dramatically increases local cerebral blood flow
During an active seizure (ICTAL), the seizure focus shows dramatically INCREASED perfusion (hyperperfusion) on brain SPECT because neuronal hyperactivity drives a large increase in local cerebral metabolic demand and blood flow. The ictal scan is injected as close to seizure onset as possible (within 30–60 seconds) to capture this hyperperfusion. Between seizures (INTERICTAL), the seizure focus typically shows DECREASED perfusion (hypoperfusion). Ictal-interictal SPECT subtraction (SISCOM — subtraction ictal SPECT co-registered to MRI) dramatically improves localization of the seizure focus for pre-surgical planning.
More brain imaging images
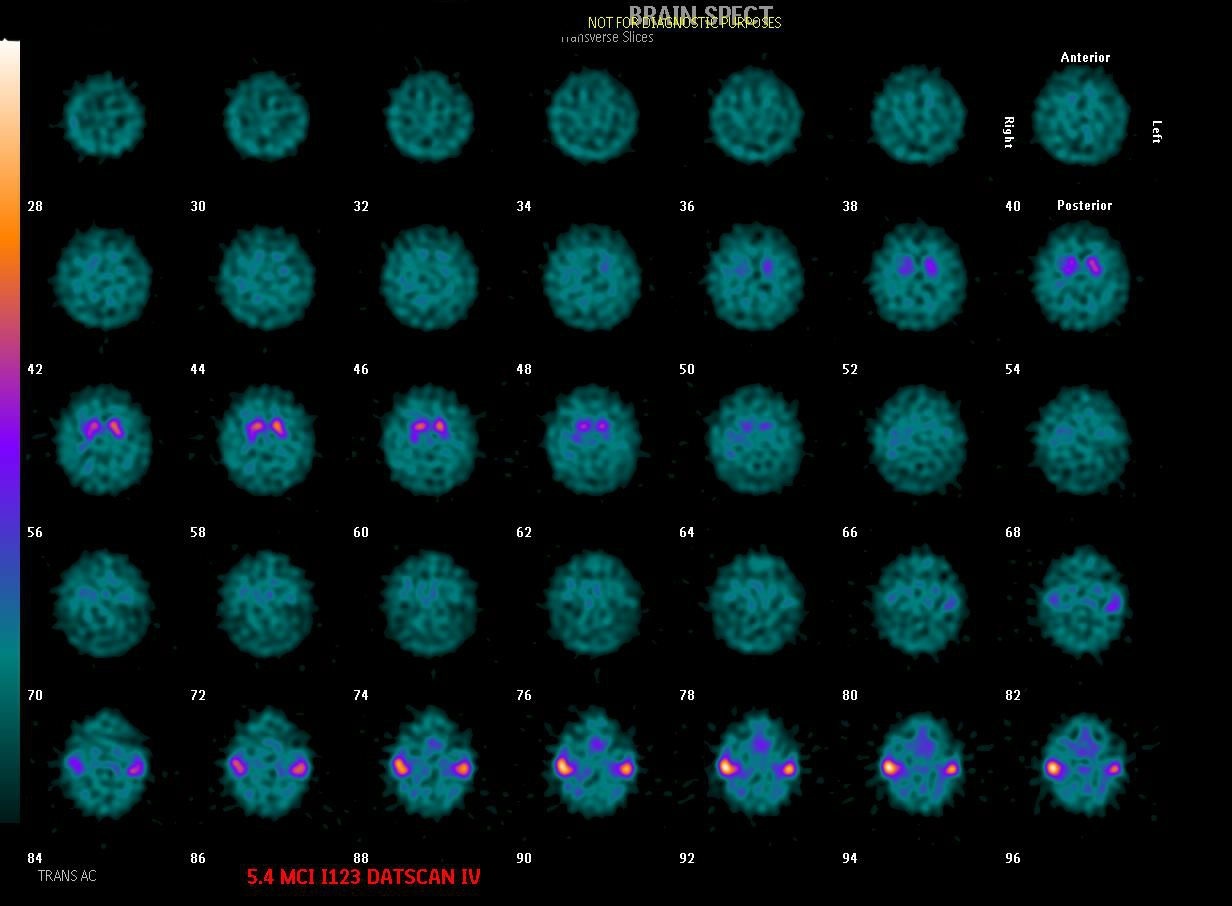 Dementia with Lewy Bodies on DaTscan
Alzheimer’s Disease on FDG PET
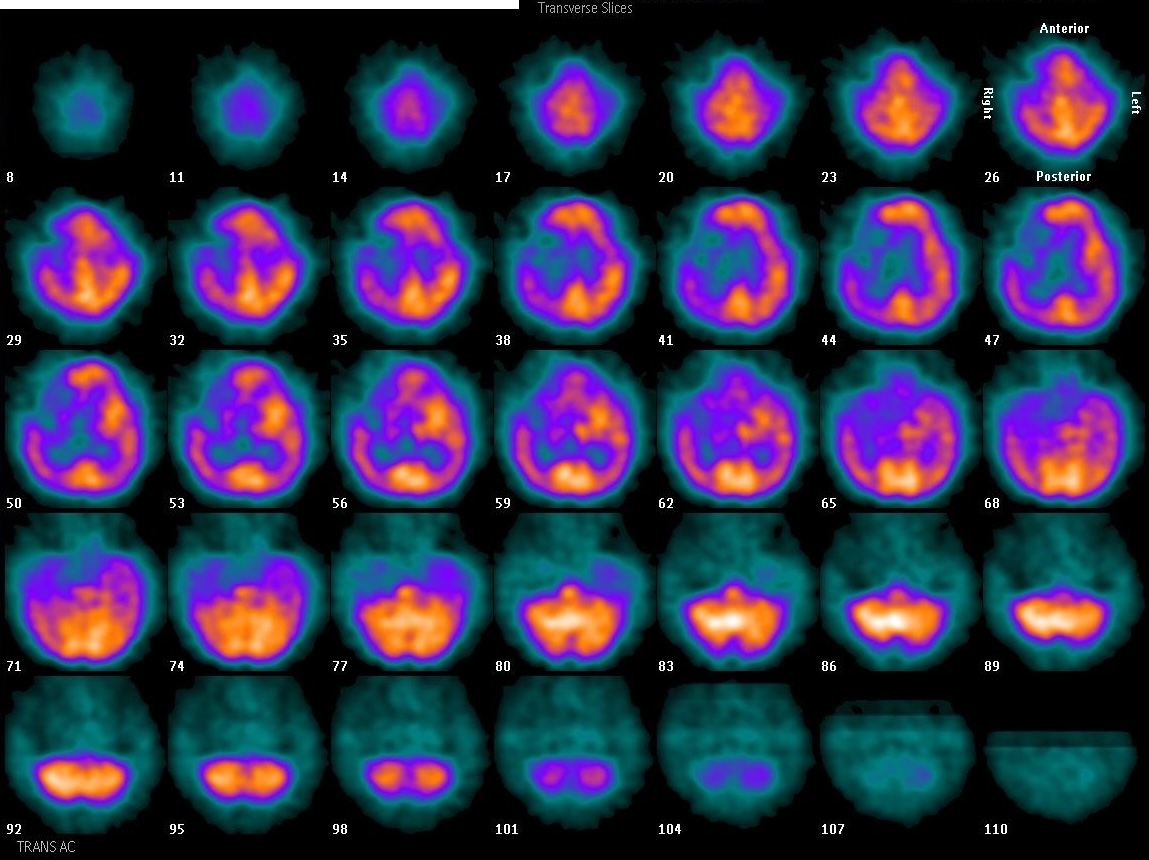 Focal Perfusion Defect on Brain SPECT
Brain Perfusion SPECT: Injection Environment
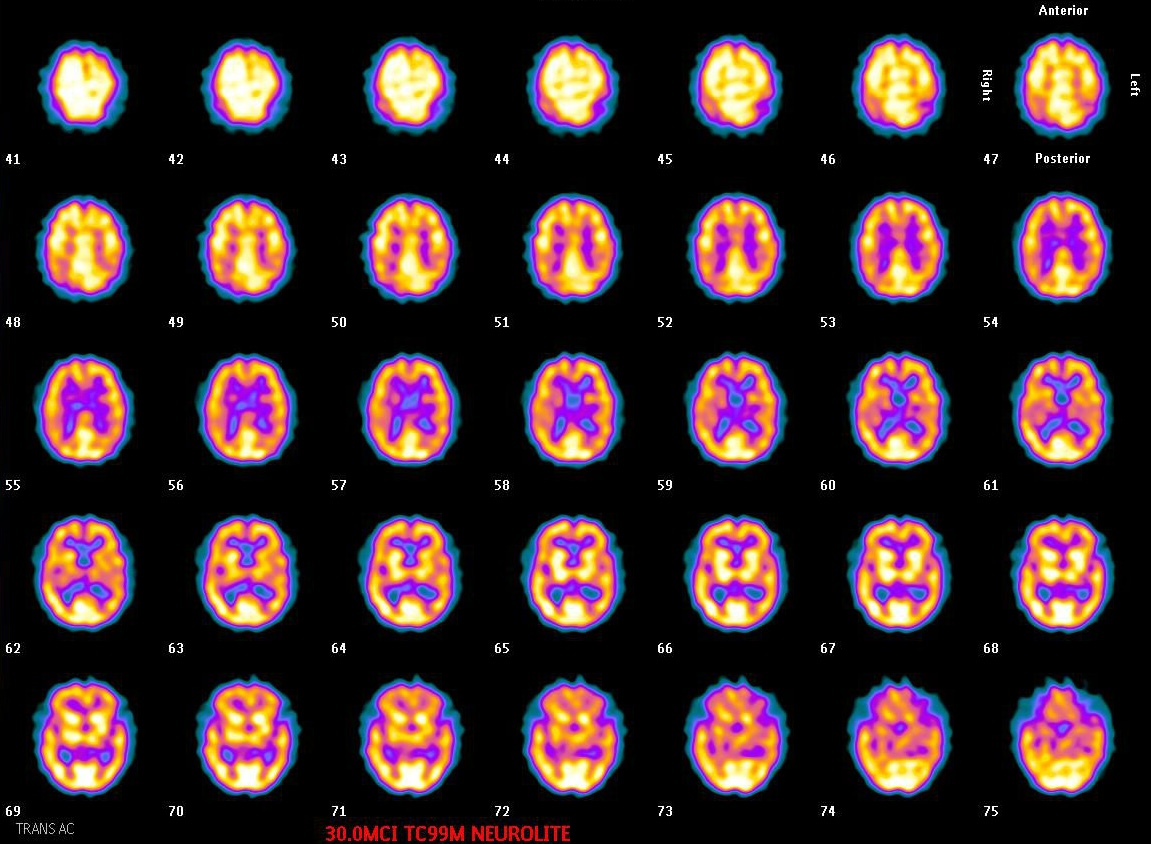 Normal Tc-99m ECD Brain SPECT: Gray vs White Matter
Brain SPECT: When to Image After ECD Injection
All 130 nuclear medicine images by category →
Practise image interpretation in the app
All 130 images as an interactive quiz, alongside 500 NMTCB and ARRT(N) questions with worked explanations, case studies and timed mock exams. 25 questions are free, no card and no account.